Trend Logging Energy Data
Trend Logging in the Building Management System
Trend Logging data within the Building Management System can be one of the most productive and useful tools within a system.
Trend logging energy data an exporting the data in programs such as Microsoft’s excel for analysis is typically a right click and your done. Making comparisons of the data with other data such as ambient temperature, humidity, occupancy, and so forth is only limited by the information being logged at the site.
Trend log energy consumption for greater analysis and better decision-making.
How does trend logging Energy data Save Money?
It is like setting the speed alarm in your car; when a thresh hold is met or continues to generate attention, we ask why what is happening in the building which generates this issue and what the cost is to rectify.
The best way to explain this is via a quick example:
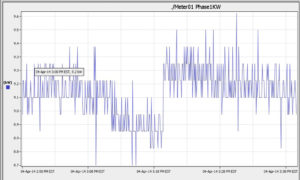
We set up a series of trends on one of our systems in a CBD hotel; the system was monitoring the mechanical services switchboard and, in particular, the chillers. The chillers were separately monitored to the mechanical services such as fans and pumps.
In a nutshell, what we found when comparing the energy load against the time of day and ambient temperature was one of the older chillers was hugely inefficient, the net result included the initial removal of the chiller from the staging until absolutely necessary, and eventually, the chiller was upgraded entirely.
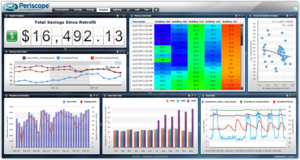
Energy Dashboard display for Commercial Buildings
The data assisted the Chief engineer to in providing evidence to the owners that the chiller upgrade had a “return on investment” in two years based on the statistic of the favoured chiller replacement.
Key Benefits of Trend logging data
- Save money in terms of labour investigation faults
- Save money in terms of offering definitive and accurate data
- Save money by awareness of losses in equipment performance
- Save money by comparison of your data versus third-party data (such as power companies)
- Save money in terms of Nabers assessments and their time on site
- Make money in terms of improving the Nabers Assessments (subject to the validation protocols)
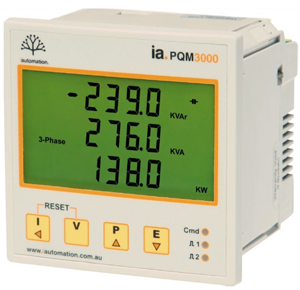
Energy Meter
Energy Meters are Simple to Install
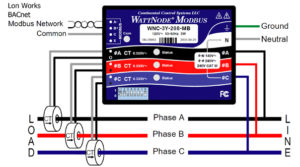
Trend logging energy data from energy meters for electrical power are quite straightforward; a “split core” current transducer is installed on the cable (three of these for three-phase). Disconnection of the cable is rarely required, so there is no need to power it down.
Install the energy meters and connect the lines from the current transducers to the energy meter
connect the volts via a circuit breaker to the energy meter (like installing any new device)
Connect the High-level Interface (HLI) from the energy meter to the Building Management System
“Map” the points, create the graphic, create the relevant trend logs and you done.
What is a “High-Level Interface”
The “High-Level Interface” allows for the data between the device (the energy meter) and the Building Management System to be delivered via a communications route (such as BACnet, LonWorks, Modbus).
Energy Meter for direct connection into BMS networks
This “data” via the HLI is produced by the meter and maintains it’s integrity; that is, the Building Management System is NOT programmed in any of the calculations of the energy data; it simply collects the values and displays the data onto a graphic or stores the data in a trend log. The Building Management System is essentially a conduit for easier access to the data.
Can we use this Energy Data for Billing Purposes?
Yes. this is subject to the calibration of the meter and the compliance of the meter with Australian Standards. The important point to realize here is the meter is doing the work; there are no calculations in the Building Management System if we are implementing a High-Level Interface. No calculations mean the meter’s integrity and calibration remain intact, which means billing can be performed.
Can We Use this data in NABERS Assessments?
Yes, for the same reasons as described above, keeping the integrity of the meter is critical; the Building Management System is purely a collection hub via the High-Level Interface.
To be 100% assured, discuss your situation with your NABERS assessor and/or the Office of Environment and Heritage (who manages NABERS) and check with the latest version of the NABERS assessment protocols.

[…] to retrieve information, to use that information (or data) to improve the resource efficiency or energy efficiency of a facility or building. We use the word “resource” rather than energy at times, because a […]